
13/04/2026
I. Market Recap
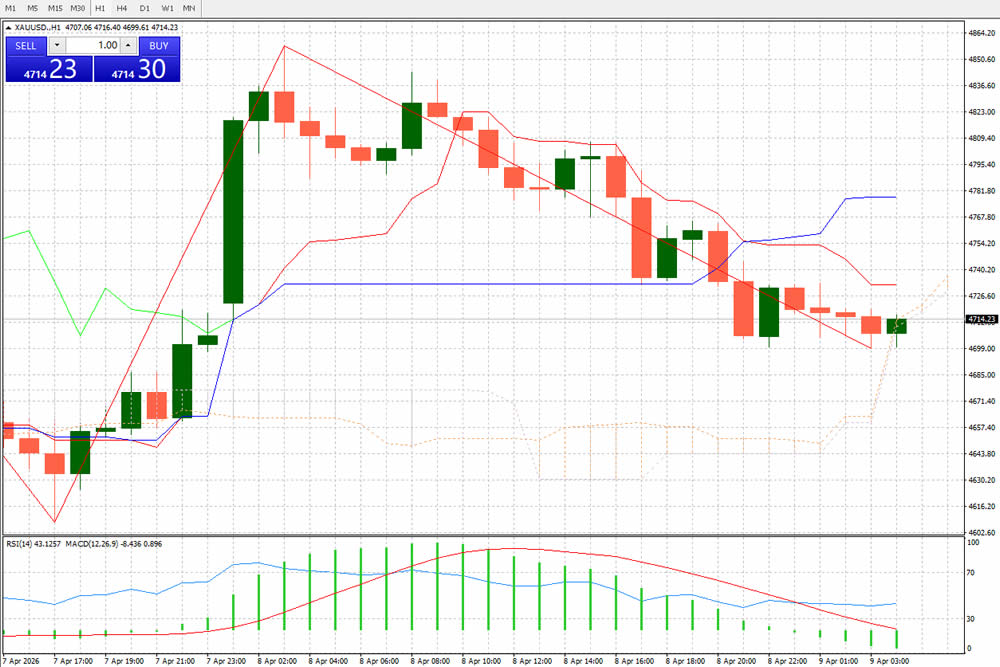
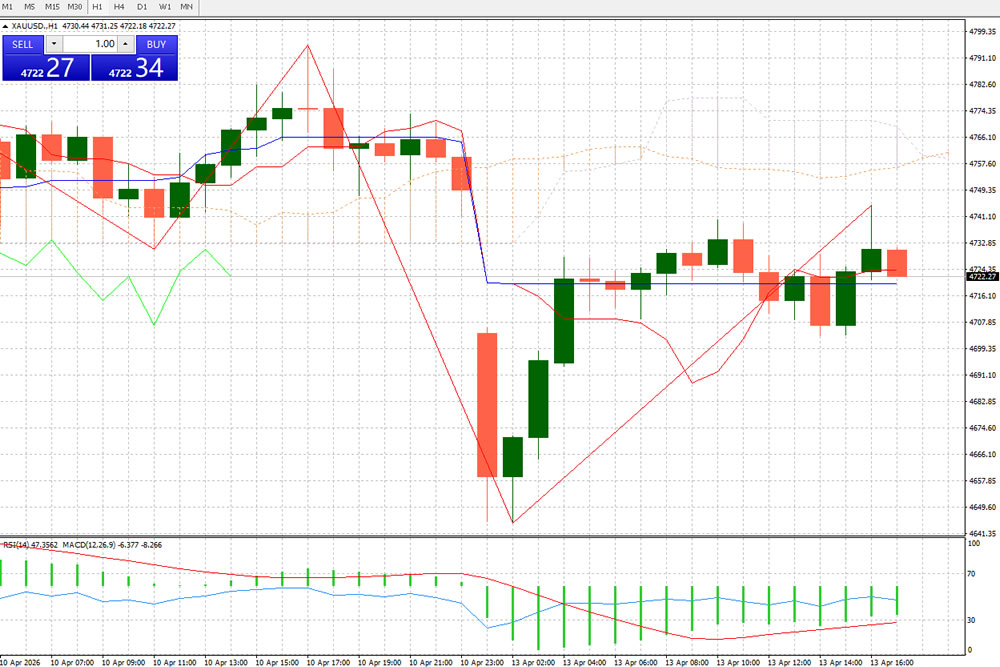
Spot gold (XAU/USD) experienced a sharp V-shaped recovery on Monday, April 13, 2026. During the Asian session, the price plummeted by more than 2% to an intraday low of $4664.12/oz, erasing all gains from last week, driven by heightened geopolitical tensions and inflation fears. It then rebounded steadily through the European session, closing at $4722.27/oz on the 1-hour chart, with a final daily gain of 1.13% at $4723.69/oz.
II. Fundamental Drivers
Key Bearish Catalyst: Failed US-Iran Talks & Strait of Hormuz Blockade
The weekend negotiations between the US and Iran in Pakistan yielded no breakthrough. President Trump announced plans to block the Strait of Hormuz with naval forces, triggering extreme concerns over a global energy supply disruption, which sent WTI crude oil surging 9% higher. The spike in energy prices further boosted global inflation expectations, pushing US Treasury yields and the US dollar higher, significantly raising the opportunity cost of holding gold and causing the early-morning sell-off.
Key Bullish Catalyst: Dip Buying & Geopolitical Risk Premium
After hitting the critical support zone of $4660-$4670, gold attracted heavy technical buying and dip-chasing capital. Meanwhile, the long-term uncertainty of the Middle East situation remains unresolved, with persistent fears of conflict escalation, providing a floor for gold prices and driving the rapid rebound from the intraday low.
Upcoming Focus
US retail sales data and Federal Reserve officials’ speeches later in the session will be the key variables. Strong data that reinforces high interest rate expectations will limit gold’s upside, while weak data could open the door for further gains.
III. 1-Hour Technical Deep Dive
- Price Structure & Trend
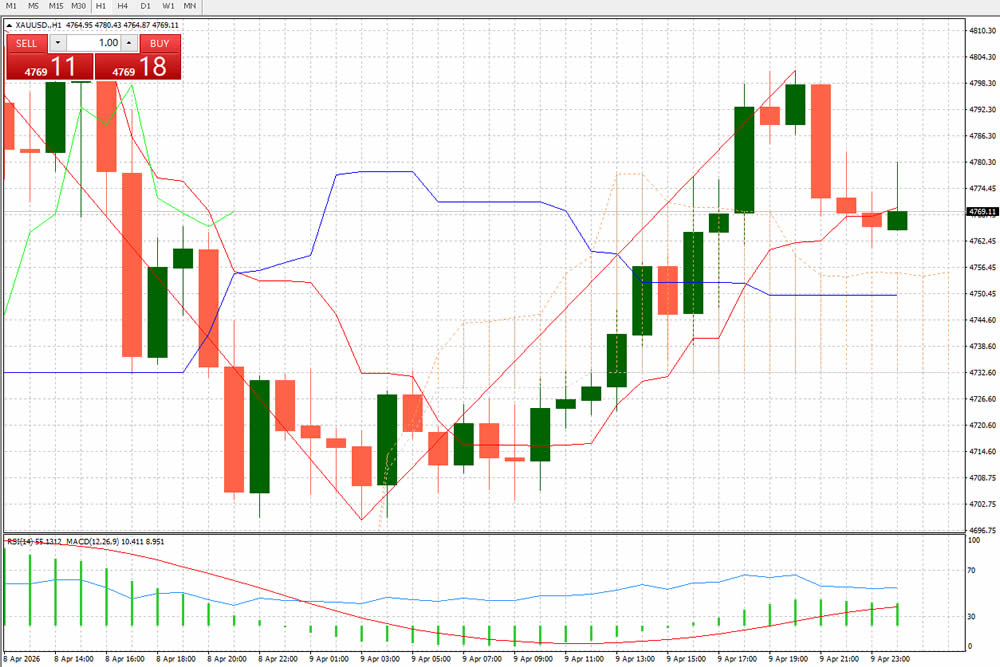
On the 1-hour chart, gold formed a phased bottom in the $4660-$4670 area after a deep decline, then entered a volatile upward correction. The price is currently trading within an ascending channel, with short-term bullish momentum recovering.
Key Resistance: $4730-$4740 (lower edge of the previous consolidation range + upper Bollinger Band). A decisive break above this level targets $4760-$4770.
Key Support: $4700-$4710 (middle Bollinger Band + short-term trendline). A break below this level will push gold back into a bearish consolidation, testing $4680-$4690.
- Indicator Signals
Bollinger Bands: The bands, which had been sharply sloping downward, are now narrowing. The price has rebounded from the lower band to above the middle band, indicating a significant decline in bearish momentum and a move into a balanced phase between bulls and bears.
MACD: The MACD lines have crossed above the zero line from below, with green bars shrinking rapidly and red bars expanding gradually, showing sustained short-term bullish momentum. However, it has not fully broken above the zero line, so the medium-term trend has not yet reversed.
RSI: The RSI has rebounded sharply from the oversold territory (below 30) to around 50, confirming the oversold recovery. It is not yet in overbought territory, leaving room for further upside.
KDJ: The KDJ formed a golden cross at the low and is moving upward, currently in a neutral-bullish range with no obvious overbought, suggesting the short-term rebound has room to continue.
- Volume & Structure
Volume surged during the early-morning decline, confirming a full release of selling pressure at the bottom. Volume increased moderately during the rebound, indicating growing buying power. The current consolidation around $4720-$4730 is a normal correction after the drop.
IV. Trading Strategy & Recommendations
- Intraday Trading Plan
Gold is in an oversold rebound and volatile correction phase with intense bull-bear confrontation. Range trading is recommended, and chasing prices should be avoided:
Long Position: Enter long on stabilization in the $4700-$4710 zone, stop-loss at $4690, target $4730-$4740, and $4760 if broken.
Short Position: Enter short on resistance in the $4735-$4745 zone, stop-loss at $4750, target $4710-$4700, and $4680 if broken.
Wait-and-See: If the price consolidates sideways in the $4720-$4730 range, stand aside and wait for a clear direction before entering.
- Risk Warning
Sudden changes in the Middle East situation and unexpected US economic data can trigger extreme volatility in gold prices. Strictly control position size, set stop-losses, and guard against black swan events.
[Disclaimer] Forex trading involves risk; please invest with caution. This content is for informational purposes and objective analysis only, and does not constitute any investment advice, basis for buying/selling, or guarantee of returns. Investors should make independent decisions based on their own financial situation and risk tolerance, and bear their own investment risks.