
07/04/2026
- Market Overview
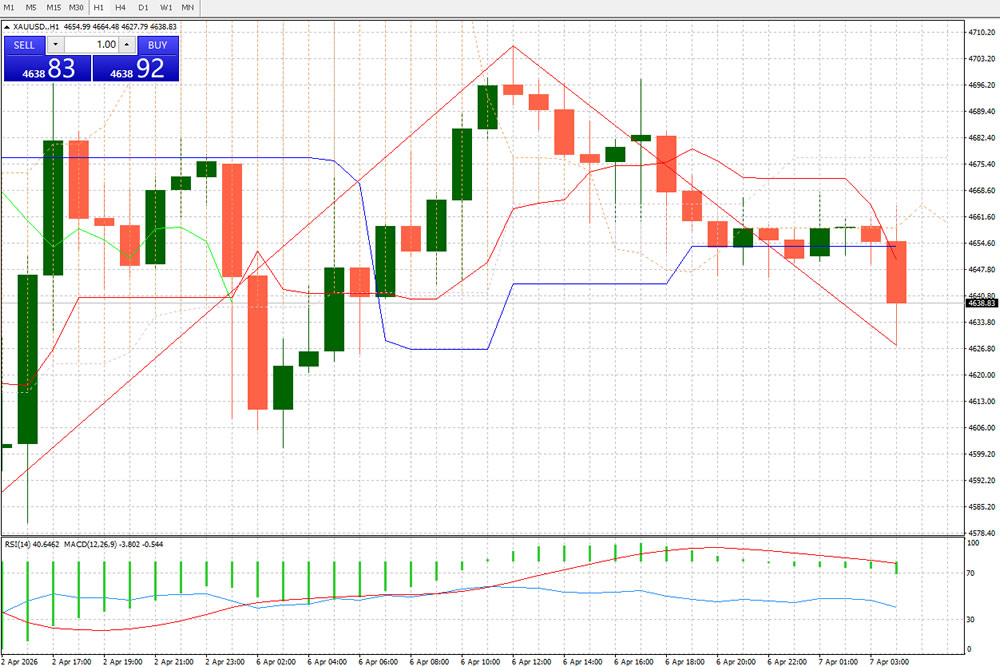
The XAU/USD pair is currently trading at 4638.83 on the 1-hour timeframe, posting a sharp drop in the latest session, with significant bearish momentum dominating the short-term trend. After rallying to a local high above 4670, gold entered a sideways-to-downward channel, and today’s break below key support levels has opened further downside potential, shifting the overall bias from neutral-bullish to firmly bearish in the short term. - Key Technical Indicator Analysis
2.1 Price & Trend Structure
The price previously consolidated in the 4654-4664 range, then rallied to a stage high of 4670.20, before entering a clear downtrend (marked by the red descending trendline on the chart). Price has consistently pulled back along the trendline, and today’s break below the critical 4654-4658 support zone confirms a trend reversal.
The Bollinger Bands are expanding downward, with price trading along the lower band, while the upper band continues to press lower, indicating sustained bearish momentum and a weak downtrend channel.
The latest candlestick is a large bearish candle that decisively broke through the previous support platform, confirming a strong release of selling pressure and ample short-term downside momentum.
2.2 Oscillators & Momentum
RSI(14): The indicator currently reads 40.6462, having declined from the overbought territory above 70 to a neutral-weak range, with a continued downward trajectory. This suggests bearish momentum is not yet exhausted, leaving room for further downside, with no clear oversold signal present.
MACD(12,26,9): The DIF line (-3.802) and DEA line (-0.544) have formed a sustained bearish crossover, with the MACD histogram expanding in negative territory. This confirms strengthening bearish momentum and validates the downtrend, with no signs of a bullish reversal.
- Key Support & Resistance Levels
Resistance: First resistance at 4654-4658 (previous support, now turned strong resistance), second resistance at 4665-4668 (descending trendline resistance), major resistance at 4670.20 (the recent swing high).
Support: First support at 4630-4632 (previous swing low), second support at 4613-4615 (prior correction low), major support at 4599-4600 (psychological integer level + historical low).
- Trading Strategy & Recommendations
4.1 Trend Assessment
Gold has entered a clear 1-hour bearish trend, with price trading in a descending channel and all indicators pointing to downside. The primary strategy is sell-on-rallies, while chasing shorts is not recommended to avoid oversold bounces.
4.2 Actionable Plan
Short Position Strategy: Enter short positions on rebounds to the 4654-4658 resistance zone, with stop-loss placed above 4662. Targets are set at 4630 (first), 4613 (second), and 4600 (third).
Long Position Strategy: No clear bullish signal is present at this time. Only consider a light long position if price finds support at 4630-4632 and shows clear reversal signals (e.g., long lower shadow, RSI oversold bounce), with stop-loss below 4625 and a target of 4650. This is a scalping trade with strict risk control.
Risk Warning: Gold prices are highly sensitive to macro factors including Fed monetary policy, geopolitical tensions, and the US Dollar Index. Technical analysis must be confirmed by fundamental developments. Always use stop-losses and manage position size strictly.
[Disclaimer] Forex trading involves risk; please invest with caution. This content is for informational purposes and objective analysis only, and does not constitute any investment advice, basis for buying/selling, or guarantee of returns. Investors should make independent decisions based on their own financial situation and risk tolerance, and bear their own investment risks.
Related Posts

16/07/2026