
08/04/2026
I. Market Review
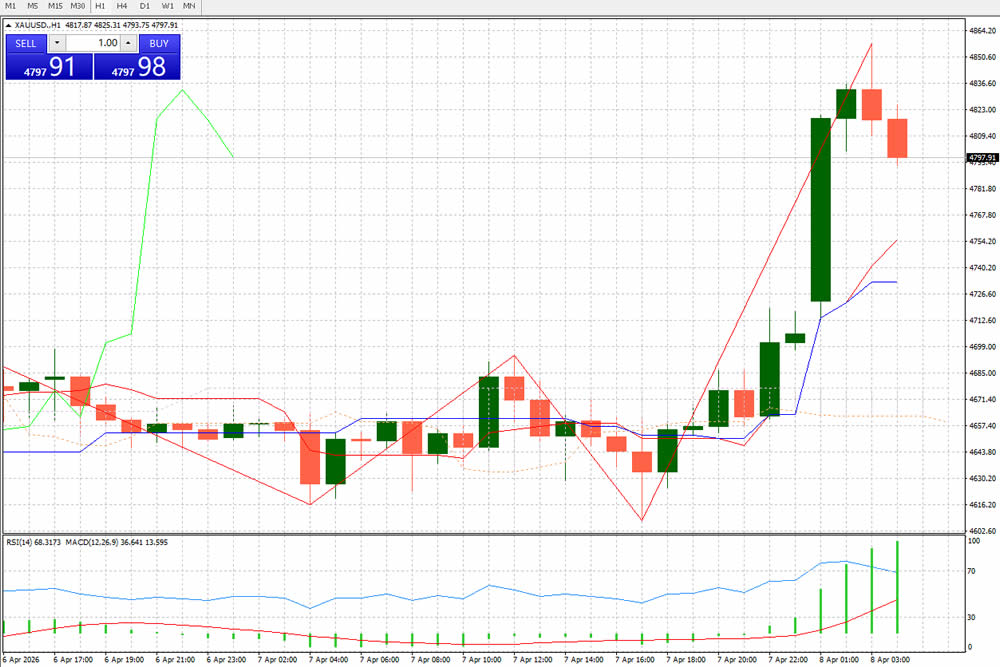
Gold (XAUUSD) has staged an extremely strong rally on the 1-hour timeframe today. Starting from around 4660, the price has surged steeply to a recent high above 4850, followed by a minor pullback at the elevated level. As of the current quote at 4797.91, the intraday gain is significant, with bullish momentum fully unleashed.
II. Core Technical Analysis
- Price Structure & Trend
Short-term Trend: A clear unilateral bullish trend has been established on the 1-hour chart. The price is trading strongly along the upper band of the red ascending channel, with the moving average system showing a perfect bullish alignment. The short-term moving average (blue line) acts as strong support for the price, and the pullback has not effectively broken below the key moving average, keeping the bullish trend structure intact.
Key Price Levels:
Resistance: The 4850-4860 zone acts as the intraday high resistance; a valid break above this level will open up further upside potential.
Support: The first support lies at 4780-4790 (short-term moving average + retest level after breaking the previous high), while the strong support is at 4740-4750 (lower band of the ascending channel + previous consolidation platform), which is the critical defensive level for the bullish trend.
- Indicator Signal Validation
RSI (14): The current RSI reading is 68.31, in the overbought territory (near 70), indicating that short-term bullish power is near its extreme, creating a need for a technical pullback. However, the indicator has not shown a clear bearish crossover, meaning bullish momentum has not fully exhausted, and the pullback is likely a high-level consolidation rather than a trend reversal.
MACD (12,26,9): The MACD line and signal line continue to diverge sharply above the zero line, with the histogram (red bars) expanding continuously, confirming extremely strong bullish momentum and a clear trending uptrend. Although the histogram shows a slight contraction, the overall bullish bias remains unchanged.
Bollinger Bands: The price is trading strongly along the upper Bollinger Band, with the band opening continuously expanding and the channel diverging upward, confirming the trending rally. While the price has temporarily moved away from the upper band, the channel structure remains strong, supporting trend continuation.
- Volume & Structure Supplement
This rally is accompanied by large bullish candlesticks, accelerating after breaking through the previous consolidation range, which is a typical “breakout + acceleration” bullish structure with a clear capital inflow signal. The small bearish candlesticks at the high are normal profit-taking during the uptrend and do not damage the trend structure.
III. Trading Strategy & Outlook
- Trend Judgment
On the 1-hour timeframe, the bullish trend is clear, and the core strategy is to buy on dips. The pullback caused by overbought conditions is only a technical correction, and blind contrarian short-selling is not recommended. - Key Trading Zones
Long Strategy:
Aggressive Entry: Enter a light long position when the price stabilizes in the 4780-4790 zone, with a stop-loss below 4765, targeting 4830-4850, and holding if the level is broken.
Conservative Entry: Wait for a pullback to the strong support zone of 4740-4750, confirm the support validity, and enter long in batches, with a stop-loss below 4720, targeting 4800-4850 for medium-term holding.
Short Strategy:
Only suitable for ultra-short-term speculation, subject to two conditions: ① The price shows obvious stagnation + a large bearish reversal candlestick at the 4850-4860 resistance; ② RSI turns down from overbought with a bearish crossover, and MACD histogram contracts sharply. Enter with a strict stop-loss above 4865, targeting 4800-4780, and close the position intraday without overnight holding.
- Risk Warnings
The intraday volatility is extremely high; strictly control position size, avoid chasing highs, and prevent large drawdowns from high-level pullbacks.
Pay close attention to the impact of important evening economic data (such as US non-farm payrolls, inflation data) on gold prices, and reduce positions before data releases to avoid uncertainty risks.
If the price effectively breaks below the 4740 strong support and a trend reversal signal appears on the 1-hour chart, adjust the strategy in a timely manner and be alert to the end of the bullish trend.
[Disclaimer] Forex trading involves risk; please invest with caution. This content is for informational purposes and objective analysis only, and does not constitute any investment advice, basis for buying/selling, or guarantee of returns. Investors should make independent decisions based on their own financial situation and risk tolerance, and bear their own investment risks.
Related Posts
16/07/2026