
10/04/2026
I. Market Overview
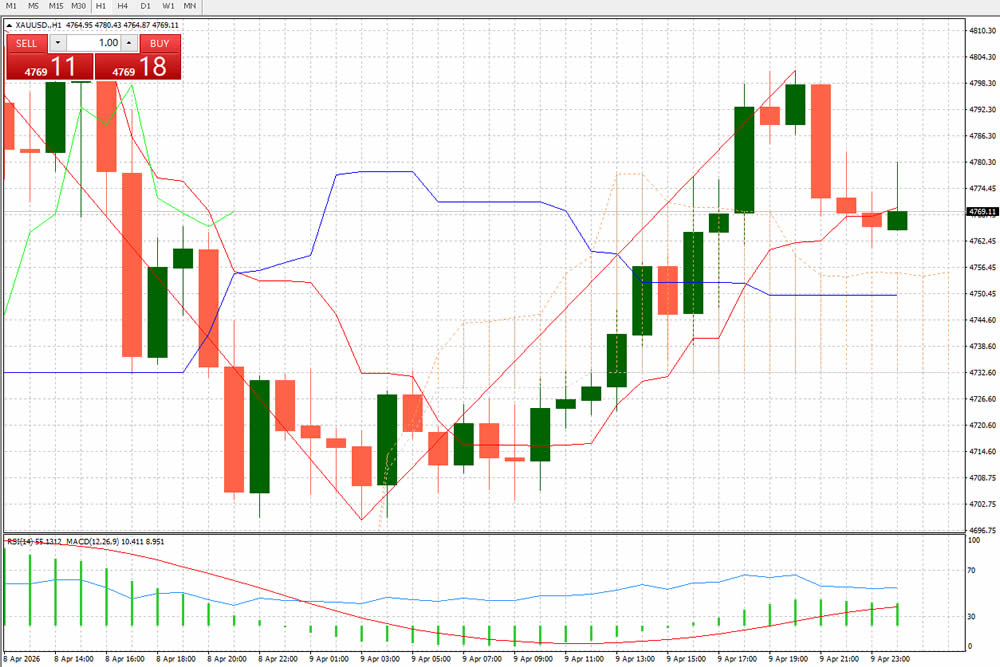
As of the early Asian session on April 10, spot gold (XAU/USD) is trading around $4769 per ounce, with an intraday high of $4801 and a low of $4698. The market has entered a phase of consolidation after a sharp rally, with prices pulling back from recent multi-day highs and facing a critical directional decision near key support levels on the 1-hour timeframe.
II. In-Depth Technical Analysis (1-Hour Chart)
- Price Structure & Trend
Ascending Channel Breakdown: Gold rallied steadily within a red ascending channel from 03:00 on April 9, peaking at $4804 before breaking below the upper trendline, confirming the end of the short-term uptrend and the start of a corrective phase.
Key Support & Resistance Levels:
Resistance: Immediate resistance at $4780-$4785 (previous swing high), strong resistance at $4798-$4805 (intraday high, former channel top);
Support: Immediate support at $4760-$4765 (current consolidation floor, Bollinger Bands midline), strong support at $4745-$4750 (Bollinger Bands lower band, prior consolidation range top). A break below $4745 would open the door to a test of $4720 (the starting point of the recent rally).
Candlestick Pattern: Recent candles show long upper/lower wicks, indicating fierce bull-bear conflict. A large bearish candle at the highs confirmed short-term selling pressure, while subsequent small-bodied candles signal fading bearish momentum and a market in wait-and-see mode.
- Indicator Signals
Bollinger Bands (BOLL): The bands remain upward-sloping overall, with prices retreating from the upper band to the midline ($4760), which now acts as the key bull-bear dividing line. A hold above the midline favors a rebound, while a break below targets the lower band at $4745.
RSI (Relative Strength Index): The 1-hour RSI has pulled back from the overbought zone (above 70) to around 55, showing a significant loss of bullish momentum. It is now in neutral territory, with no clear overbought/oversold signal, awaiting a directional breakout.
MACD: The MACD line (DIF) has crossed below the signal line (DEA) to form a death cross, with the green histogram expanding, confirming short-term bearish dominance. Continued expansion of the histogram will extend the correction, while a contraction could signal a rebound.
- Technical Conclusion
Gold is in a corrective phase following its recent rally, with $4760 as the critical pivot:
Bullish Scenario: A hold above $4760 targets resistance at $4780-$4800;
Bearish Scenario: A break below $4760 targets support at $4745-$4720;
Range-Bound Scenario: $4745-$4780, with a buy-low/sell-high strategy recommended ahead of key data releases.
III. Fundamental & News-Driven Catalysts
- Core Macro Drivers
Fed Monetary Policy Expectations: Market pricing for a June rate cut remains intact, while the March FOMC minutes revealed a split among officials over inflation risks and geopolitical shocks. The upcoming US March CPI data (April 11) will be the key determinant: a lower-than-expected print will boost rate-cut expectations and gold, while a hot inflation reading will reinforce hawkish Fed sentiment and weigh on prices.
Geopolitical Risk: The escalating US-Israel-Iran conflict has disrupted shipping through the Strait of Hormuz, driving oil prices higher and fueling global safe-haven demand, which acts as a core floor for gold prices. Any further escalation in tensions could trigger a new surge in gold.
Central Bank Gold Buying: Global central banks have maintained net gold purchases for consecutive years, with the People’s Bank of China increasing reserves for 16 straight months. This state-level strategic allocation provides solid long-term support for gold, limiting downside risk.
- Key Events Today & Tomorrow
Focus on US initial jobless claims data and the latest developments in the Middle East conflict during the session;
The US March CPI data, due at 20:30 on April 11, will be the decisive factor for gold’s medium-term trend, with heightened volatility expected around the release.
IV. Trading Strategy & Risk Warnings
- Intraday Trading Plan
Long Position: Enter a light long position if prices stabilize in the $4750-$4755 zone, with a stop-loss at $4742 and targets at $4775-$4780;
Short Position: Enter a light short position if prices reject resistance at $4780-$4785, with a stop-loss at $4792 and targets at $4760-$4755;
Breakout Strategy: Follow through with a short position if $4745 is broken, targeting $4720; follow through with a long position if $4785 is broken, targeting $4800. - Risk Warnings
Sudden geopolitical escalations or de-escalations can cause extreme price swings; strict stop-losses are mandatory;
The US CPI data may trigger significant market volatility; reduce position sizes ahead of the release;
Monitor the US Dollar Index and US Treasury yields closely, as their movements directly impact gold prices.
[Disclaimer] Forex trading involves risk; please invest with caution. This content is for informational purposes and objective analysis only, and does not constitute any investment advice, basis for buying/selling, or guarantee of returns. Investors should make independent decisions based on their own financial situation and risk tolerance, and bear their own investment risks.
Related Posts

16/07/2026