
14/04/2026
Core Market Review (Combined with 1-hour XAU/USD Chart)
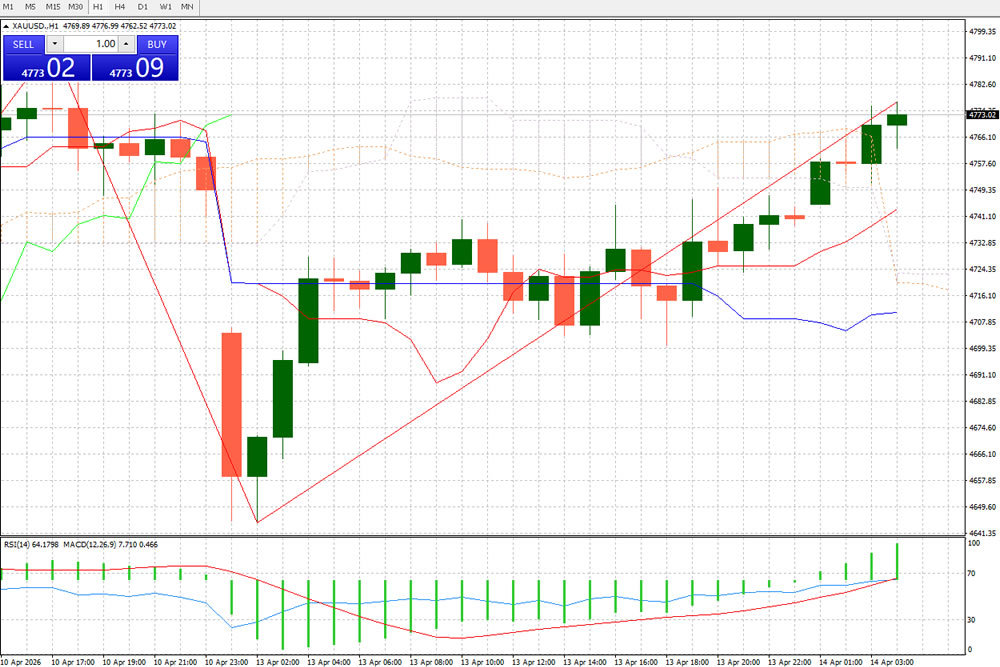
The 1-hour gold (XAU/USD) chart reveals a classic intraday trend of sharp early decline followed by a V-shaped reversal and oscillating upward movement, which is highly consistent with the market sentiment fluctuations triggered by the collapse of US-Iran negotiations.In the early session, gold plummeted to around $4,640 per ounce, hitting the intraday low, as reflected by the large gap-down red candlesticks on the chart. This drop was driven by the US announcement of a maritime blockade on the Strait of Hormuz and the complete failure of US-Iran talks. Subsequently, the market entered a “sell the news” phase, and supported by liquidity buying and central bank gold purchases in the $4,600-$4,650 support zone, gold staged a V-shaped reversal. A series of green bullish candlesticks emerged, gradually recapturing lost ground. As of the writing, gold has returned to above $4,770, forming a clear ascending channel (red ascending trend line) on the 1-hour chart, with prices firmly above the middle band of the Bollinger Bands, indicating a gradual recovery of short-term bullish momentum.
In terms of technical indicators on the 1-hour timeframe: the 14-period RSI rebounded from oversold territory to around 48, showing balanced long-short 博弈 without overbought sentiment; the MACD indicator shows expanding red histograms, with the DIFF line breaking above the DEA line to form a short-term golden cross, confirming the short-term rebound trend; from the Bollinger Bands perspective, prices are trading near the upper band with an upward opening, reflecting a strong oscillating pattern in the short term.
Core Fundamental Drivers
Geopolitics: US-Iran Deadlock Dominates Short-Term Sentiment, Between Safe-Haven and Inflation LogicsThe 21-hour high-level US-Iran talks in Islamabad ended without agreement. The US launched a maritime blockade on the Strait of Hormuz, Iran issued a stern warning against foreign military vessels, and Israel entered a high state of alert, pushing the Middle East situation back to the brink of war. This event has a dual impact on gold: on one hand, geopolitical safe-haven sentiment should have boosted gold prices; on the other hand, the blockade sent Brent crude oil surging to $98 per barrel, exacerbating global inflation expectations and further cooling market expectations for Fed rate cuts in 2026 (CME data shows the probability of a rate cut before December is less than 1/5). The rising opportunity cost of holding non-interest-bearing gold under a high-interest-rate environment suppressed gold prices in the short term. Eventually, the game between safe-haven buying and inflationary pressure created the oscillating trend of a sharp early decline followed by a rebound.
Monetary Policy: Shifting Fed Policy Expectations, Core Bearish Logic for Gold RemainsUS March CPI data exceeded expectations, coupled with a surge in crude oil prices, inflation stickiness has resurfaced. Fed officials have released hawkish signals, pushing market expectations for a 2026 rate cut from June to September, and some institutions predict no rate cuts for the whole year. Under a high-interest-rate environment, the attractiveness of gold as a non-interest-bearing asset is weakened, which is the core macro factor weighing on gold in the early session. However, continuous central bank gold purchases worldwide (the People’s Bank of China has increased gold holdings for 17 consecutive months) have built a strong support zone of $4,600-$4,650 for gold, limiting the room for a sharp drop.
Market Correlation: Reverse Transmission Between the US Dollar and Crude OilThe US dollar index briefly strengthened in the early session and then reversed, falling 0.2% on the day, providing some support for gold. Meanwhile, crude oil prices rose 3% to around $98 per barrel, indirectly suppressing gold through the inflation channel. The inverse fluctuations between the two further exacerbated the wide-range oscillating trend of gold on the 1-hour timeframe.
Intraday Trading and Outlook
Key Price Levels
Support Levels: $4,700 (middle band of 1-hour Bollinger Bands, previous oscillating platform), $4,650 (intraday low, central bank gold purchase cost line), $4,600 (strong psychological + technical support).
Resistance Levels: $4,780 (upper band pressure on 1-hour chart), $4,820 (previous oscillating high), $4,850 (medium-term rebound target).
Trading Rhythm ForecastAsian Session: Continuation of oscillating recovery, with prices likely to fluctuate in the $4,730-$4,780 range. Bulls need to hold above $4,750 to make further upward moves.European Session: The market digests the impact of geopolitical news, and long-short tends to be moderate. Pay attention to the effectiveness of the $4,700 support; a break below may trigger a test of $4,650.US Session: The release of US March PPI data in the evening is the core catalyst. If PPI data falls short of expectations, cooling inflation expectations will boost gold, potentially pushing it to $4,800. If data exceeds expectations, rising inflation concerns will drag gold back to around $4,700.
Trading and Risk Control SuggestionsFor short-term trading, adopt a range-bound strategy: buy low and sell high in the $4,700-$4,780 range, with a stop loss of $50 per ounce. For long-term investors, consider分批 building positions in the $4,650-$4,700 range. Rely on the long-term support of central bank gold purchases and geopolitical safe-haven demand, with a target of $4,850. It is necessary to stay alert to extreme safe-haven triggered by the escalation of the US-Iran conflict and short-term risks brought by higher-than-expected inflation data.
[Disclaimer] Forex trading involves risk; please invest with caution. This content is for informational purposes and objective analysis only, and does not constitute any investment advice, basis for buying/selling, or guarantee of returns. Investors should make independent decisions based on their own financial situation and risk tolerance, and bear their own investment risks.
Related Posts
16/07/2026