


06/10/2026

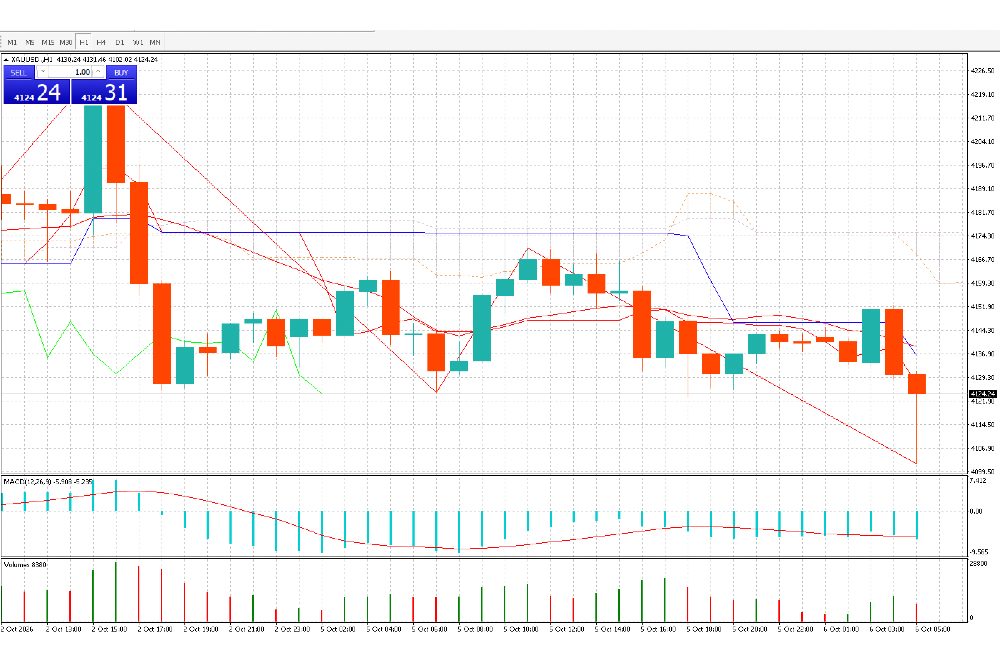
On Tuesday, Oct 6, spot gold (XAUUSD) remains under pressure during the Asian session, currently trading near $4124 per troy ounce. From the 1-hour candlestick chart, gold failed to sustain its rebound above the resistance zone near $4150, followed by heavy sell-off. A large bearish candlestick has formed, indicating that bearish momentum has regained control in the short term.
Technical Analysis
On the H1 timeframe, the price failed to hold above dynamic resistance after the bounce, with the trend channel pointing downwards. Custom indicator lines have turned bearish, confirming the release of selling pressure. The MACD histogram is expanding below the zero line, showing strengthening bearish momentum. Trading volume rose alongside the price drop, reflecting active capital selling.
- Short-term Resistance: $4144–$4150, the previous consolidation zone. Any bounce to this range will likely attract strong selling interest.
- Short-term Support: Primary support sits at $4110–$4120. The next major support level is at $4095. A valid break below $4110 will open further downside potential for gold.
Fundamental Drivers
The market is caught in a tug-of-war between bullish and bearish factors. On the bearish side, long-dated US Treasury yields stay at multi-year highs, while the US Dollar remains resilient. As a non-yielding asset, gold faces sustained pressure from elevated opportunity costs. On the supportive side, US September Non-Farm Payrolls came in far below forecasts. Traders have cut the odds of a Fed rate hike in October to roughly 22%, which limits the scope for deep declines in gold prices.
Market participants are waiting for the release of the September FOMC meeting minutes due on Wednesday. Hawkish rhetoric in the minutes could push Treasury yields higher and weigh further on gold. Dovish signals, by contrast, may fuel a technical bounce.
Risk Disclaimer: Forex and CFD trading carry high risk. Market prices can shift rapidly due to breaking news. Always manage position size and stop-loss levels strictly. This analysis is for educational purposes only and does not constitute investment advice.