
17/04/2026
- Core Market Overview
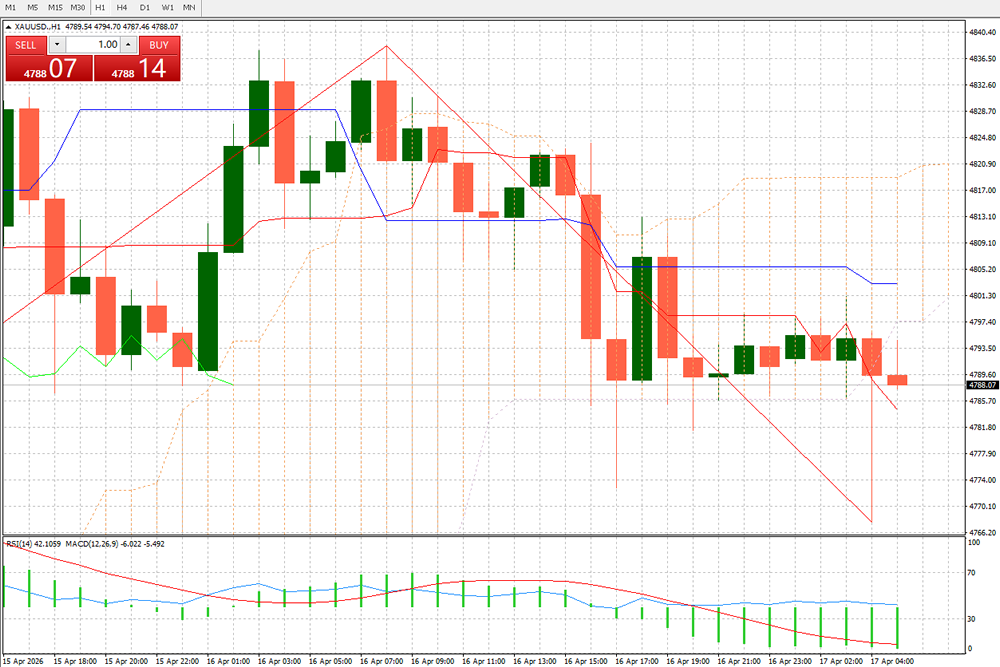
On April 17, 2026, the 1-hour chart of XAUUSD (Spot Gold) presents a high-level and weakening pattern. The current quotation hovers around $4,788 per ounce, with an intraday high hitting $4,840.07 and a low of $4,774.64, representing a 0.61% intraday decline. From the 1-hour K-line structure, gold prices plummeted rapidly after hitting a daily high, forming a distinct peak-reversal pattern. The moving average system shows a clear bearish alignment, with the short-term bullish momentum completely exhausted. - Core Fundamental Drivers
Geopolitical Risk Sentiment Cools: The Trump administration announced a 10-day ceasefire agreement between Israel and Lebanon, and the US and Iran plan to resume nuclear talks in Pakistan this weekend, with Iran signaling concessions. The détente in the Middle East directly led to a sharp withdrawal of safe-haven buying in gold, and the drop in oil prices alleviated inflationary pressures, further weakening gold’s inflation-hedging demand support.
Persistent Hawkish Fed Rate Expectations: CME FedWatch Tool data shows that the probability of a Fed rate cut in June has dropped to zero, and the probability of a cut in September is only 62%. The market’s pricing of “higher interest rates for longer” continues to deepen. The US dollar index rebounded slightly to 98.20 today, and the high level of US bond yields directly pushes up the opportunity cost of holding gold, forming a direct suppression on gold prices.
Divergence in Institutional Funds: While holdings of the world’s largest gold ETF (SPDR Gold Trust) increased slightly by 1.143 tons, non-commercial net long positions in COMEX gold futures have reduced for two consecutive weeks, indicating increasing willingness among institutions to take profits, creating a long-short game pattern with physical buying.
- In-depth Technical Analysis (1-hour Timeframe)
K-line Pattern & Structure: On the 1-hour chart, gold prices have repeatedly failed to break above the $4,830-$4,850 range, forming a small M-top pattern with the neckline at around $4,780. The current price has broken below the neckline of the M-top, further testing the $4,770 support zone, confirming a clear short-term bearish signal.
Indicator Signal Verification: On the 1-hour level, the MACD indicator’s fast and slow lines formed a death cross above the zero axis, with green bar momentum continuing to expand, confirming that upward momentum has completely turned into downward momentum. The RSI indicator dropped rapidly from the overbought zone to near 30; although not in the oversold range, short-term rebound power is scarce. The Bollinger Bands system opens downward, with prices running along the lower rail, extending the bearish trend.
Key Level Definition:
Short-term Resistance: $4,800 (first intraday rebound pressure), $4,810 (US session drop-start point), $4,835 (strong resistance zone, a breakout will reverse the short-term bearish trend);
Core Support: $4,770 (daily low + Fibonacci 38.2% retracement level), $4,750 (medium-term support, a break will trigger a further decline), $4,700 (trend defense level).
- Intraday Trading Strategy & Risk Warnings
Short-term Strategy: Prioritize selling on rallies. Establish short positions in batches at the $4,800-$4,810 range, set a stop loss above $4,825, and target $4,770 and $4,750. If gold breaks below $4,770, follow up with short positions,targeting $4,730-$4,720.
Medium-term Strategy: The foundation of the bullish trend remains intact; this is only a short-term correction. Accumulate long positions in batches at the $4,720-$4,700 range, set a stop loss below $4,680, and target a rebound to $4,800-$4,830.
Risk Warnings: US economic data (PMI, initial jobless claims) released tonight and the progress of Middle East talks may trigger sharp market fluctuations. Strictly control positions and avoid chasing prices. The Fed’s interest rate meeting minutes next week will further guide policy direction, and the current range-bound pattern is likely to be broken.
[Disclaimer] Forex trading involves risk; please invest with caution. This content is for informational purposes and objective analysis only, and does not constitute any investment advice, basis for buying/selling, or guarantee of returns. Investors should make independent decisions based on their own financial situation and risk tolerance, and bear their own investment risks.
Related Posts
16/07/2026