
01/04/2026
Market Overview
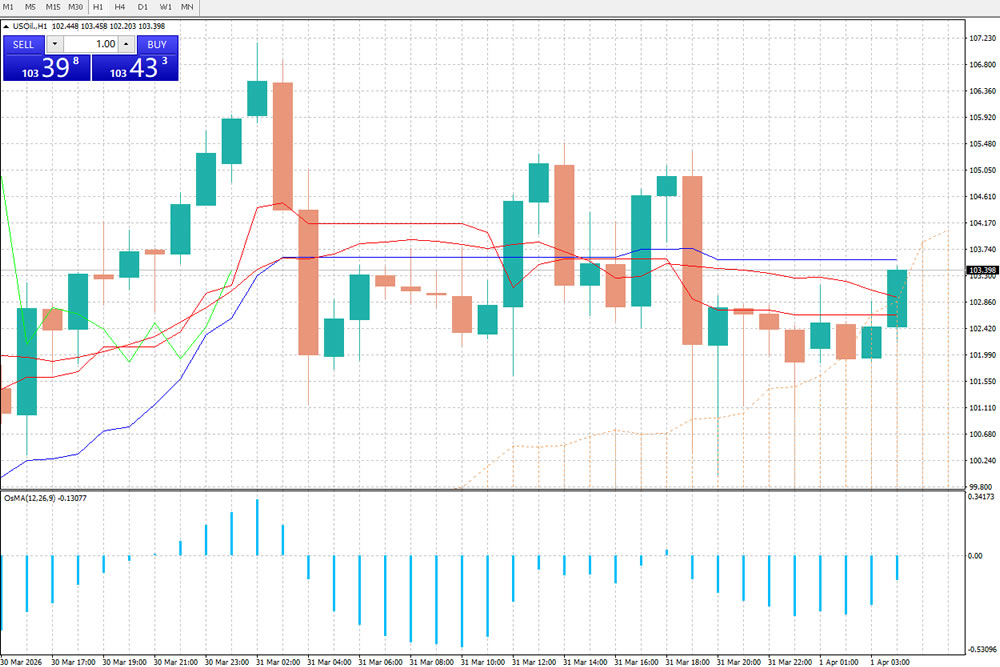
USOIL (WTI Crude Oil) is currently trading at 103.398 on the 1-hour timeframe, in a short-term rebound pattern after a recent pullback. Since hitting the local low near 100.68 in the early hours of March 31, the price has gradually stabilized and rebounded, reclaiming the 103 handle as of the morning of April 1. While short-term bullish momentum has recovered, the asset remains stuck in a medium-term sideways range, with ongoing two-way volatility.
Technical Breakdown
- Price Structure & Key Levels
Resistance Zones:
First Resistance: 104.10 – 104.60 (the upper bound of the recent consolidation range, tested multiple times on March 31, acting as the immediate cap for bulls)
Second Resistance: 106.80 – 107.20 (the March 30 swing high, a critical medium-term trend resistance; a break above here would confirm a new uptrend)
Support Zones:
First Support: 102.40 – 102.80 (the recent range low and a cluster of short-term moving averages, a key defense level for bulls)
Second Support: 101.00 – 101.50 (the secondary retest low on March 31, a strong support zone; a break below here would end the rebound and resume the downtrend)
- Moving Averages Analysis
The multi-period moving averages show a short-term bullish turn, medium-term sideways structure:
Short-term MAs (green/red lines) have reversed from a downtrend to an uptrend, with the price now trading above them, confirming short-term bullish dominance on the 1-hour chart and a valid rebound.
The medium-term MA (blue line) remains flat, indicating no clear medium-term trend reversal, and the overall structure remains range-bound, limiting the upside of the current rebound. - Oscillator (ChMA/OsMA) Signal
The ChMA (12,26,9) indicator currently reads -0.13077, still below the zero line, but bearish histogram bars are shrinking sharply, which means bearish momentum is fading rapidly, and bullish momentum is accumulating, driving the price rebound.The indicator has not yet crossed above the zero line, meaning a medium-term trend reversal is not confirmed; the current move is only a post-crash recovery, not a new bull trend. - Candlestick & Momentum
Recent candlesticks show a “bottoming-out + small bullish rebound” structure. The long lower shadow candlestick on the evening of March 31 confirmed support near 101, and the bullish candle on the morning of April 1 further strengthened the rebound.However, the bullish candles have moderate bodies with no explosive volume surge, indicating weak buying enthusiasm at higher levels, so the rebound is likely to be choppy rather than a one-way rally.
Trading Strategy & Recommendations
- Intraday Trading Plan
The market is in a post-crash rebound + range-bound phase. The core strategy is “buy on dips, sell on rallies”, with strict position control and no chasing.
Long Entry: Enter a light long position when the price pulls back to the 102.40-102.80 support zone and stabilizes. Stop loss below 101.80, first target 104.00, second target 104.60.
Short Entry: Enter a light short position when the price rallies to the 104.10-104.60 resistance zone and fails to break out. Stop loss above 105.00, first target 103.00, second target 102.00.
Breakout Trading: If the price breaks and holds above 104.60, chase long with a target of 106.00-106.80. If it breaks below 101.50, chase short with a target of 100.00-99.80. - Risk Warnings
Crude oil prices are highly sensitive to geopolitics, OPEC+ policies, and macroeconomic data; technical signals must be adjusted dynamically with fundamental developments.
The 1-hour timeframe is for short-term trading only. The 4H/daily timeframe remains range-bound, so be alert for a second pullback after the short-term rebound.
Intraday volatility is extreme. Always set a strict stop loss, control position size to within 5% of total capital, and avoid holding losing positions.
Outlook
In the short term, crude oil has completed a post-crash rebound in the 101-104 range, with bullish momentum recovering, but the medium-term trend has not reversed, and the price may retest support repeatedly.If the price breaks and holds above 104.60, it will open up new upside towards the previous high of 106.80. If it fails to break out, it will likely return to the 101-104 range, or even test the 100 handle.Investors should focus on the breakout of the 104.60 resistance and the validity of the 101.50 support, and trade with the trend.
[Disclaimer] Forex trading involves risk; please invest with caution. This content is for informational purposes and objective analysis only, and does not constitute any investment advice, basis for buying/selling, or guarantee of returns. Investors should make independent decisions based on their own financial situation and risk tolerance, and bear their own investment risks.
Related Posts
16/07/2026