FXCG – Gold (XAU/USD) 1-Hour Chart Technical Analysis (2026/03/13)
1. Market Overview
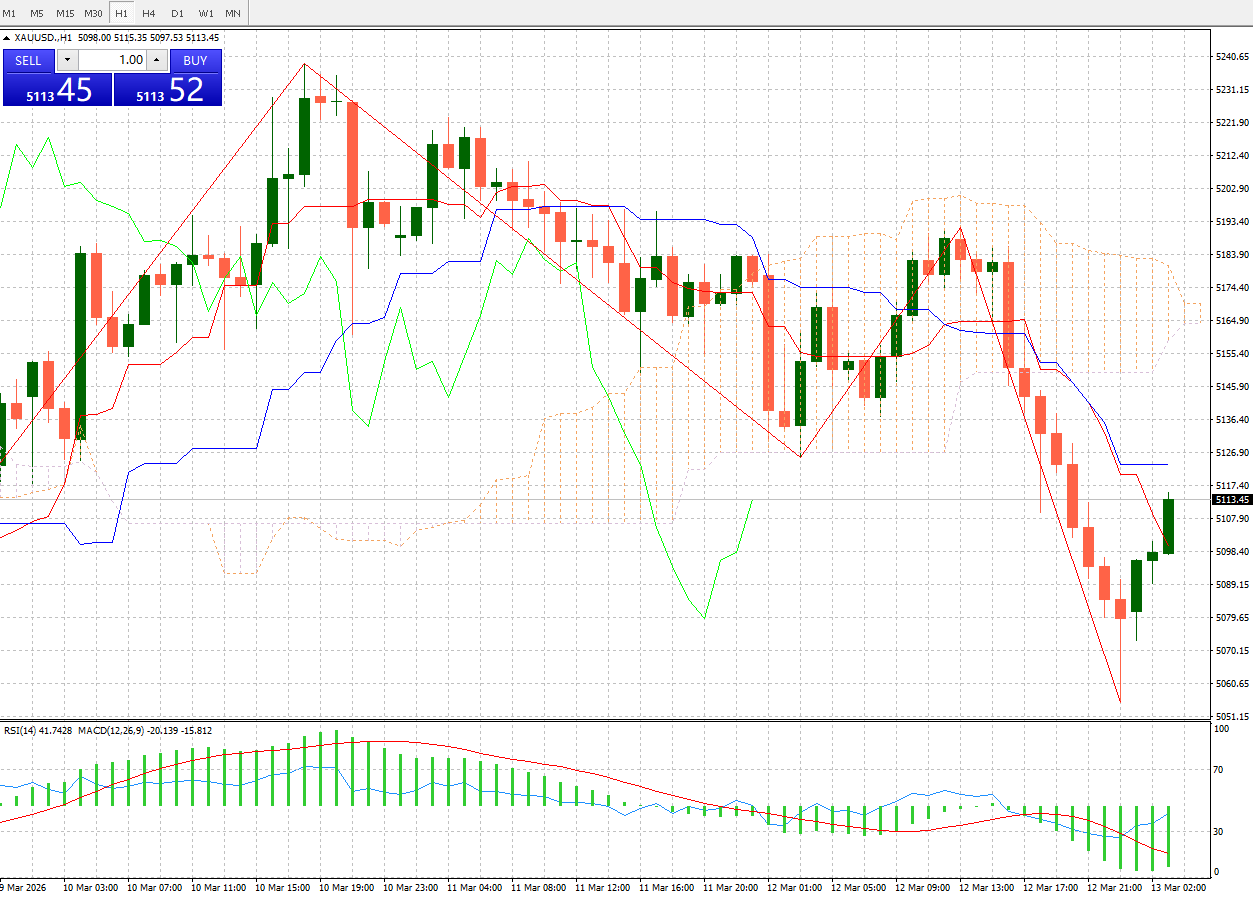
The 1-hour chart of XAUUSD shows that the price has initiated a unilateral downtrend from the intraday high of $5193/oz around noon on Mar 12, hitting a low of $5061/oz, followed by a minor rebound to consolidate near $5113/oz. The overall structure remains in a weak corrective pattern.
2. Technical Indicator Analysis
Moving Averages: The price consistently trades below the blue medium-term moving average (MA), which is sloping downward clearly, confirming a bearish trend. The short-term MA also follows suit, capping the upside potential.
Bollinger Bands: The price oscillates near the lower band, while the upper and middle bands shift downwards with a slightly narrowing width, indicating a slowdown in the short-term decline without a clear reversal signal.
RSI(14): The current reading is 41.74, staying in the neutral-to-bearish zone. Although it has rebounded slightly from the oversold territory (below 30), it has not yet crossed the 50 threshold, suggesting that bullish momentum remains weak.
MACD(12,26,9): Both the MACD line and signal line are below the zero line, with persistent green histogram bars, indicating that selling pressure still dominates and the current rebound is likely a technical correction.
3. Key Levels & Trading Strategy
Support Levels: The recent low of $5061/oz acts as the first support; a break below would target the $5040–$5020/oz zone.
Resistance Levels: $5140/oz (short-term MA pressure) and $5170/oz (previous consolidation platform) are key resistance areas.
Trading Recommendations:
Short-term bearish bias: Initiate short positions on rejection at $5140–$5150/oz, with a stop loss above $5170/oz and targets at $5080–$5060/oz.
Cautious bullish approach: If the price firmly holds above $5140/oz and RSI breaks above 50, consider long positions with a stop loss below $5110/oz and targets at $5170–$5190/oz.
4. Outlook
Gold remains vulnerable to weak consolidation and downside risks amid a stronger U.S. dollar and recovering risk sentiment. Further guidance is needed from Fed monetary policy expectations and geopolitical risks. A break below key support would extend the bearish trend, while a decisive close above resistance may trigger a staged rebound.
[Disclaimer] Forex trading involves risk; please invest with caution. This content is for informational purposes and objective analysis only, and does not constitute any investment advice, basis for buying/selling, or guarantee of returns. Investors should make independent decisions based on their own financial situation and risk tolerance, and bear their own investment risks.
before: Crude Oil (USOil) Market Analysis (March 12, 2026)
next: FXCG Market Analysis : Asian stocks followed U.S. stocks lower, with oil prices in focus.