Crude Oil (USOil) Market Analysis (March 12, 2026)
1. Market Overview
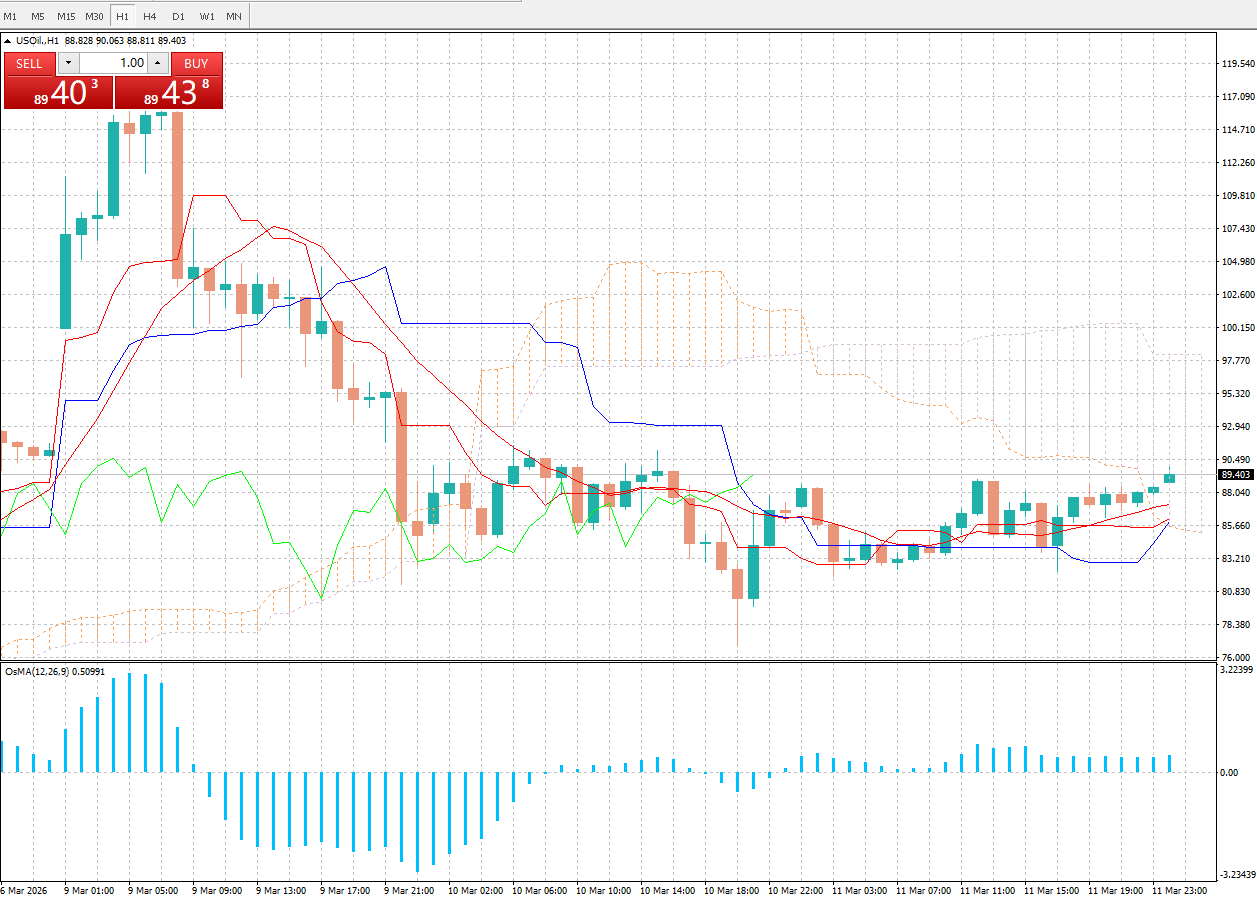
The 1-hour chart of WTI Crude Oil (USOIL) shows that the price is currently trading around $89.40, following a sharp decline and entering a low-level consolidation phase. Key technical observations are as follows:
– Moving Averages: The short-term (red) and medium-term (blue) moving averages are converging, with the price holding above them, indicating a tentative recovery in bullish momentum, though no clear trend breakout has been established.
– Trading Range: Price action is confined within a range of $83.20 – $90.50. The $83.20 level acts as a near-term critical support, while $90.50 represents a significant resistance zone. A range-bound pattern is likely to persist until a breakout occurs.
– Oscillator (OsMA): The OsMA indicator has crossed from negative to positive territory, suggesting accumulating buying pressure, but the reading remains weak, signaling limited upside potential and the risk of a retest of lower levels.
2. Technical Breakdown
1. Support & Resistance Levels
– Support: $85.60 (recent lower bound of consolidation), $83.20 (year-to-date low, strong support)
– Resistance: $90.50 (upper bound of consolidation + MA resistance), $92.90 (medium-term downtrend line resistance)
2. Trend Assessment
The 1-hour trend remains in a weak corrective rebound, with the medium-term downtrend intact. A decisive close above $90.50 and a break of the blue medium-term MA are required to confirm a short-term bullish shift. Conversely, a break below $85.60 would likely trigger a retest of the $83.20 low, potentially extending the bearish move.
3. Trading Strategy Recommendations
– Conservative Approach: Wait for a confirmed breakout above $90.50 followed by a retest to go long, targeting $92.90 – $95.00. Alternatively, enter short positions on a break below $85.60, targeting $83.20 – $80.80.
– Aggressive Approach: Trade within the current range ($86.00 – $89.50) with light positions, placing stop-losses just outside the range boundaries (±$0.50).
3. Risk Factors
Crude oil prices remain sensitive to geopolitical tensions, OPEC+ production cut expectations, and macroeconomic data. Traders should closely monitor the upcoming API/EIA U.S. Crude Inventory reports: a larger-than-expected drawdown could fuel a rebound, while a build in inventories may accelerate declines. Strict risk management and position sizing are essential to mitigate volatility.
[Disclaimer] Forex trading involves risk; please invest with caution. This content is for informational purposes and objective analysis only, and does not constitute any investment advice, basis for buying/selling, or guarantee of returns. Investors should make independent decisions based on their own financial situation and risk tolerance, and bear their own investment risks.
before: Morgan Stanley believes the oil price shock could delay the Federal Reserve’s next rate cut.
next: FXCG – Gold (XAU/USD) 1-Hour Chart Technical Analysis (2026/03/13)