FXCG – USOil 1-Hour Forex Trading Analysis(26/03/2026)
1. Market Overview
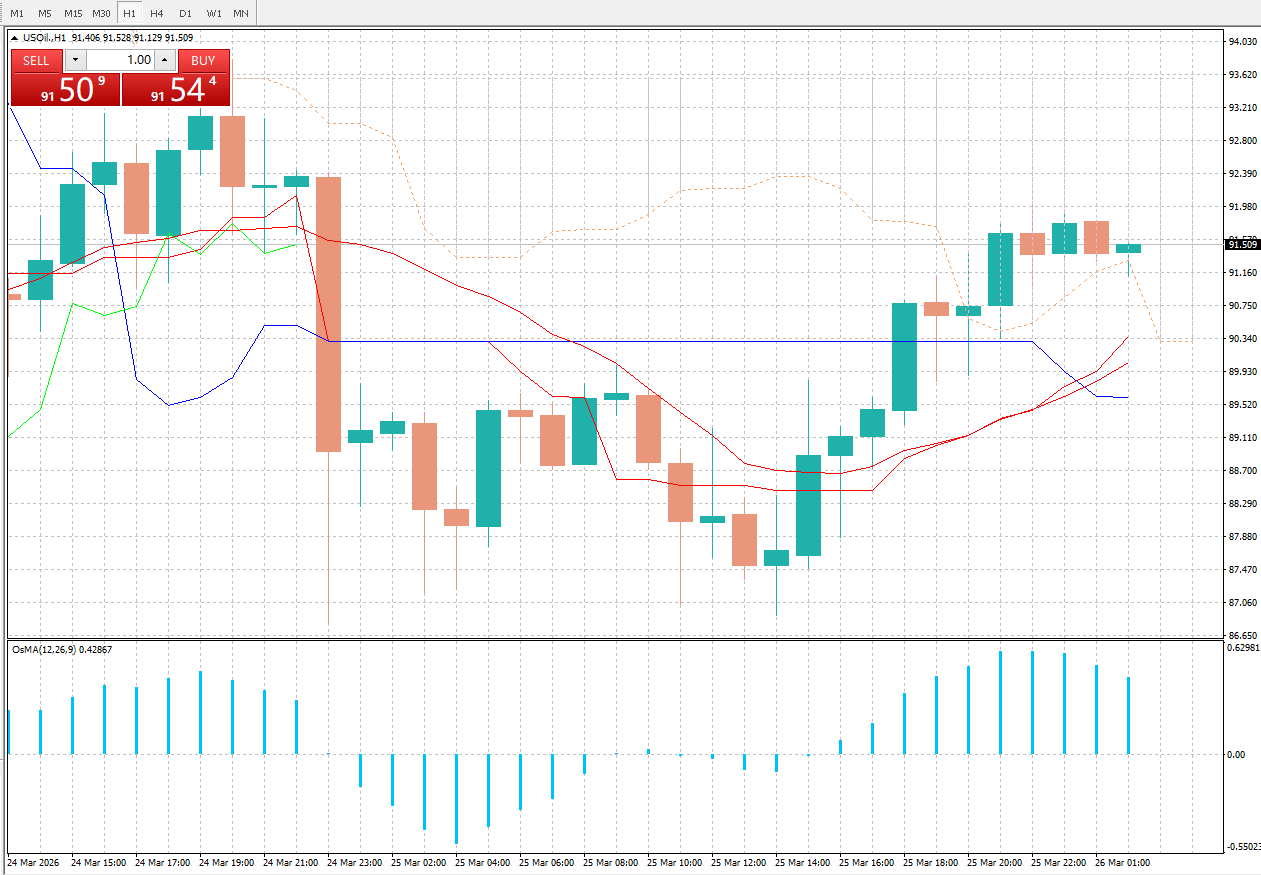
WTI crude oil (USOIL) is trading within a range of 86.65-93.62 on the 1-hour chart, with the latest price at $91.509/bbl. After a sharp sell-off from late March 24 to early March 25, prices found strong support at 86.65 and staged a V-shaped recovery, reclaiming levels above $91 and entering a strong consolidation phase.
2. Technical Breakdown
Moving Averages: The red and blue moving averages have formed a golden cross and are diverging upward. Prices are currently trading above the averages, which act as dynamic support, confirming a dominant short-term bullish trend.
Price Action:
Downtrend phase: Late March 24 saw consecutive large bearish candles, breaking below the previous platform with increased volume, confirming short-term bearish control.
Rebound phase: After bottoming early March 25, prices rallied sharply with consecutive bullish candles and rising volume, indicating strong buying pressure.
Current phase: Prices are consolidating around 91.5 with alternating small candles, reflecting a pause for digestion after the rally, with no clear topping signals yet.
Oscillator (OsMA):
The indicator remained negative during the sell-off, signaling strong bearish momentum.
It has since turned positive and stays above the zero line, showing that bullish momentum is still expanding without clear signs of exhaustion.
Key Levels:
Support: 90.34 (previous low) and 89.11 (moving average cluster). A break below would invalidate the rebound trend.
Resistance: 91.98 (recent rebound high) and 92.39 (previous high). A breakout could target levels above 93.
3. Trading Strategy & Outlook
Short-term Trend: The 1-hour chart remains in a rebound uptrend, with bulls in control.
Trading Recommendations:
Bullish Bias: Buy on dips to the 90.34-90.75 zone if support holds, targeting 91.98-92.39, with a stop loss below 89.90.
Bearish Bias: If prices break below 90.34 with OsMA turning negative, follow the breakdown to target 88.70-87.46, with a stop loss above 91.20.
Risk Warning: Monitor API/EIA inventory data, Middle East geopolitical tensions, and USD index volatility, as unexpected news or data could disrupt the current technical structure.
[Disclaimer] Forex trading involves risk; please invest with caution. This content is for informational purposes and objective analysis only, and does not constitute any investment advice, basis for buying/selling, or guarantee of returns. Investors should make independent decisions based on their own financial situation and risk tolerance, and bear their own investment risks.
before: Improving US-Iran Diplomatic Prospects Drive US Treasury Bond Prices Higher
next: Trump Extends US-Iran Negotiation Deadline; Asian Stocks May Face Pressure to Fall