FXCG – Oil(USOil)1-Hour Forex Trading Analysis(20/03/2026)
I. Market Overview
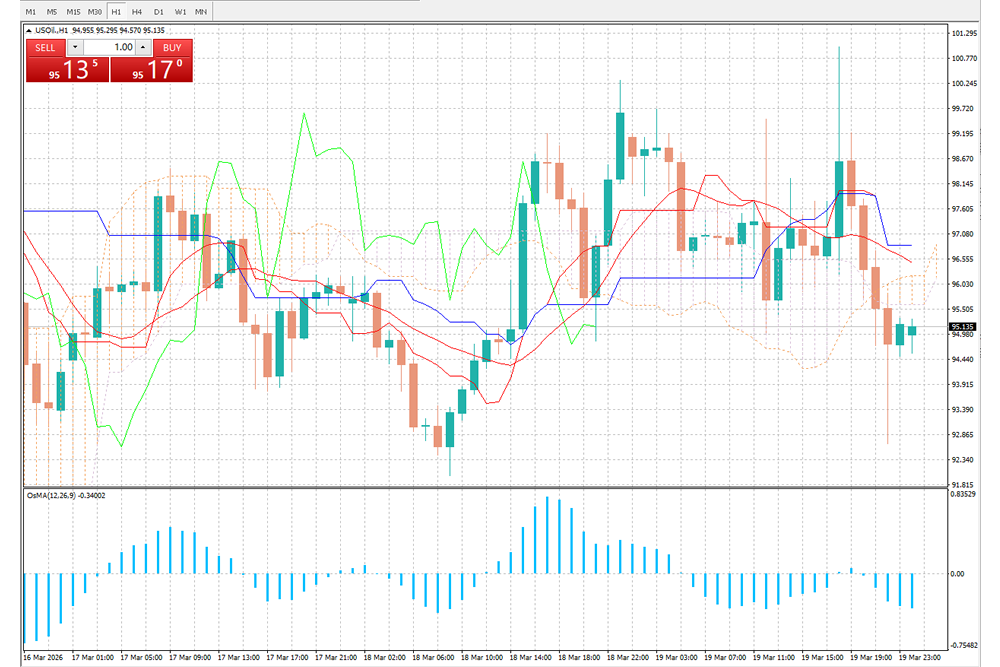
The WTI Crude Oil (USOIL) 1-hour chart shows a bearish, pullback-dominated short-term trend, with the latest price around $95.135 per barrel. After hitting a local high of $101.295, prices corrected sharply, and following a wide range-bound consolidation between $93 and $98, the market has resumed its downward move, with bearish momentum firmly in control in the near term.
II. Key Technical Indicator Analysis
1. Price & Trend Structure
Prices have broken below the lower bound of the recent consolidation range, with consecutive bearish candlesticks confirming a short-term downtrend;
Key Resistance Levels: $96.50 (upper bound of the consolidation range, moving average resistance), $98.00 (recent rebound high), $100.00 (psychological integer level);
Key Support Levels: $94.00 (recent swing low), $93.00 (lower bound of the consolidation range), $92.00 (critical near-term support).
2. Momentum & Moving Average Indicators
Prices have decisively broken below the red/blue moving average bands and the orange Ichimoku cloud, with the moving average system turning bearish, acting as strong resistance for any rebound;
The cloud has shifted from expansion to contraction, and prices are trading firmly below the cloud, confirming a trend-driven bearish market, with the cloud itself becoming a key resistance level for future rallies;
The green momentum oscillator (similar to RSI/CCI) has retreated to oversold territory, but no clear bullish crossover reversal signal has emerged, indicating insufficient rebound momentum in the short term.
3. OsMA (Oscillator of Moving Averages)
The OsMA indicator currently reads -0.34002, with histograms consistently below the zero line and no significant narrowing, confirming that bearish momentum is still being released, with no signs of exhaustion;
Sustained trading below the zero line validates the bearish trend on the 1-hour timeframe; only a move back above the zero line will signal a potential short-term rebound.
III. Bullish/Bearish Logic & Trading Strategy
1. Core Market Logic
Bearish Dominance: Breakdown of the consolidation range, bearish moving average alignment, and OsMA below zero line triple-confirm the short-term downtrend, with rallies facing consistent resistance;
Potential Bullish Opportunity: As prices approach the strong support zone of $93-$94, a bullish divergence in OsMA and a reversal candlestick pattern (e.g., hammer, bullish engulfing) could trigger an oversold rebound, but this should be treated as a counter-trend trade, not a trend reversal.
2. Intraday Trading Strategy
(1) Short Strategy (Trend-Following, Primary)
Entry Reference: Enter a short position on a rebound to the $96.00-$96.50 zone (moving average + cloud resistance), provided the OsMA does not break strongly above the zero line;
Stop-Loss: Above $98.00 (a break above the recent rebound high invalidates the bearish trend);
Take-Profit Targets: First target $94.00, second target $93.00, third target $92.00.
(2) Long Strategy (Counter-Trend, Secondary, Short-Term Only)
Entry Reference: Enter a small long position on a dip to the $93.00-$93.50 zone, if a reversal candlestick and bullish OsMA divergence appear;
Stop-Loss: Below $92.00 (a break below critical support invalidates the rebound logic);
Take-Profit Targets: First target $95.00, second target $96.00, with partial profit-taking at these levels to avoid holding counter-trend positions.
IV. Risk Warnings
Crude oil prices are highly sensitive to geopolitical events, OPEC+ production decisions, US inventory data, and USD index fluctuations, and technical trends can reverse sharply on breaking news;
The 1-hour timeframe is a short-term cycle, with limited trend sustainability. Always confirm the broader trend on the 4-hour/daily chart to avoid counter-trend trading;
Intraday volatility is extreme. Strictly implement stop-losses, control position sizes, and hedge against black swan events that could trigger extreme price moves.
[Disclaimer] Forex trading involves risk; please invest with caution. This content is for informational purposes and objective analysis only, and does not constitute any investment advice, basis for buying/selling, or guarantee of returns. Investors should make independent decisions based on their own financial situation and risk tolerance, and bear their own investment risks.